

Christmas is a wonderful time of year. It’s an opportunity to connect with the people we love to enjoy the wonders of winter. And in this festive atmosphere, the Christmas tree definitely plays a central role!
I’m wondering if it’s possible to make a good or bad choice of tree… and if there’s a way to establish a test to determine on the spot if our choice will be loved by everyone.
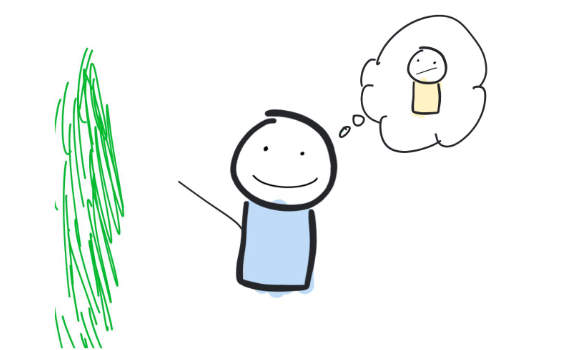
Let me introduce Carl. Carl loves the holidays… and especially decorating the tree!

He’s on the hunt for the perfect Christmas tree, with the good intention of not disappointing his loved ones again this year!
After all, this decision has a major impact, since the tree will be on display to everyone for nearly a month! Not counting its appearances in photos shared on social media (that’s another topic ;)). Okay. How can we help Carl choose his tree?
First, we’ll want to compare the trees to one another. And to do that, we have to find a model that can simplify our thought process a bit. Overall, this model should make the situation simpler, but still be realistic! So I suggest we talk about TRIANGULAR trees. If you’re not already convinced by my choice, maybe a quick example would be more effective. 😉

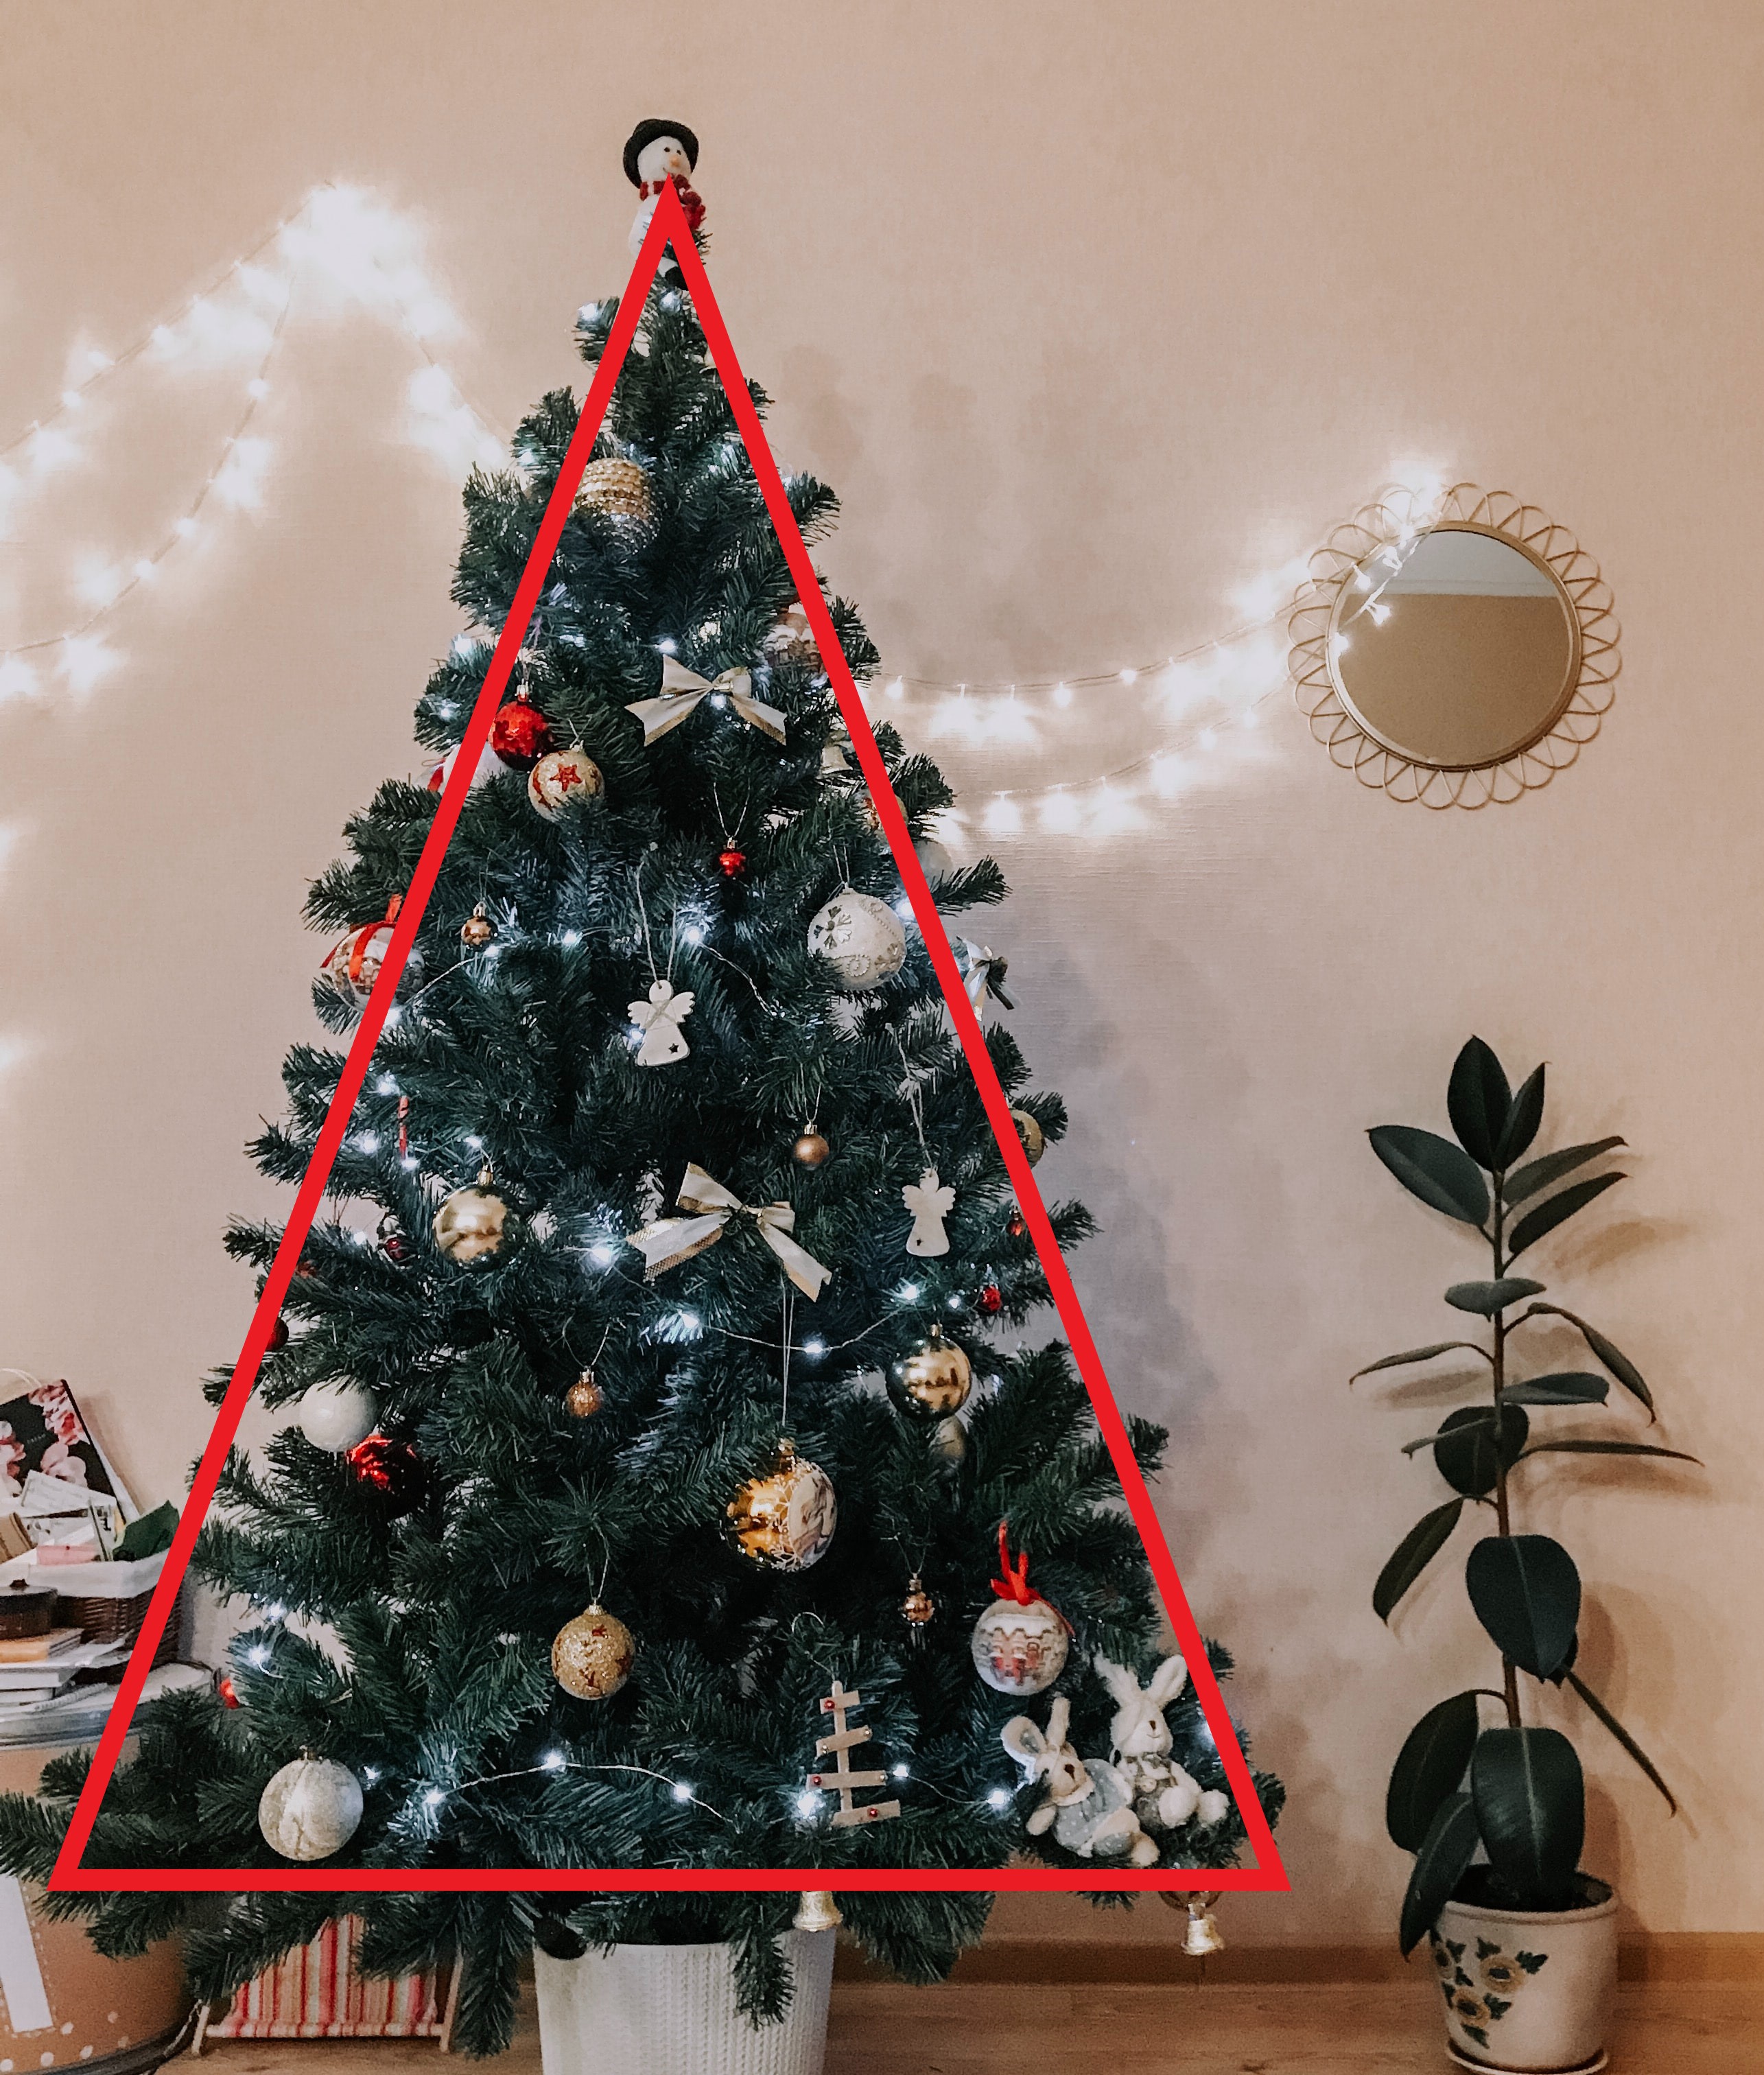
Carl chooses his triangle tree
Like we said, to make a choice, Carl should compare the trees to one another! He makes the great decision to consider the height and width of the trees.
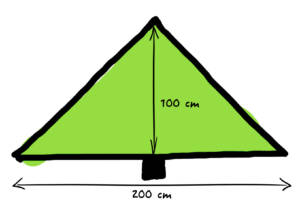
For example, when Carl observes this tree (let’s call it tree 1), he notes that the height is 100 cm and the width is 200 cm.But Carl quickly realizes that it’s not so simple to rely on 2 values (height and width) for each tree.
He needs to find a way to simplify the information.
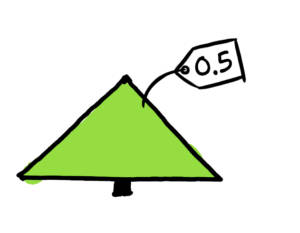
Suddenly, a stroke of genius… determine the ratio between the height and the width. To use the same example, Carl makes this calculation: (100 cm)/(200 cm) = 0.5. That’s the new label that he gives tree 1.
Carl gets to work and categorizes all the trees he can see! He quickly realizes 2 things:
- Several trees that are different sizes can have the same label (ratio).
- Some labels are ALWAYS associated with trees that are less than ideal.
Let’s consider these 2 discoveries one at a time!
Several trees have the same labelLet’s go back to the case of tree 1. Its label is 0.5 because that’s the ratio between 100 cm (height) and 200 cm (width). But when you think about it, we could imagine a tiny little tree that is 10 cm tall and to respect the ratio of 0.5, its width would have to be 20 cm. This tree would also have a label of 0.5.
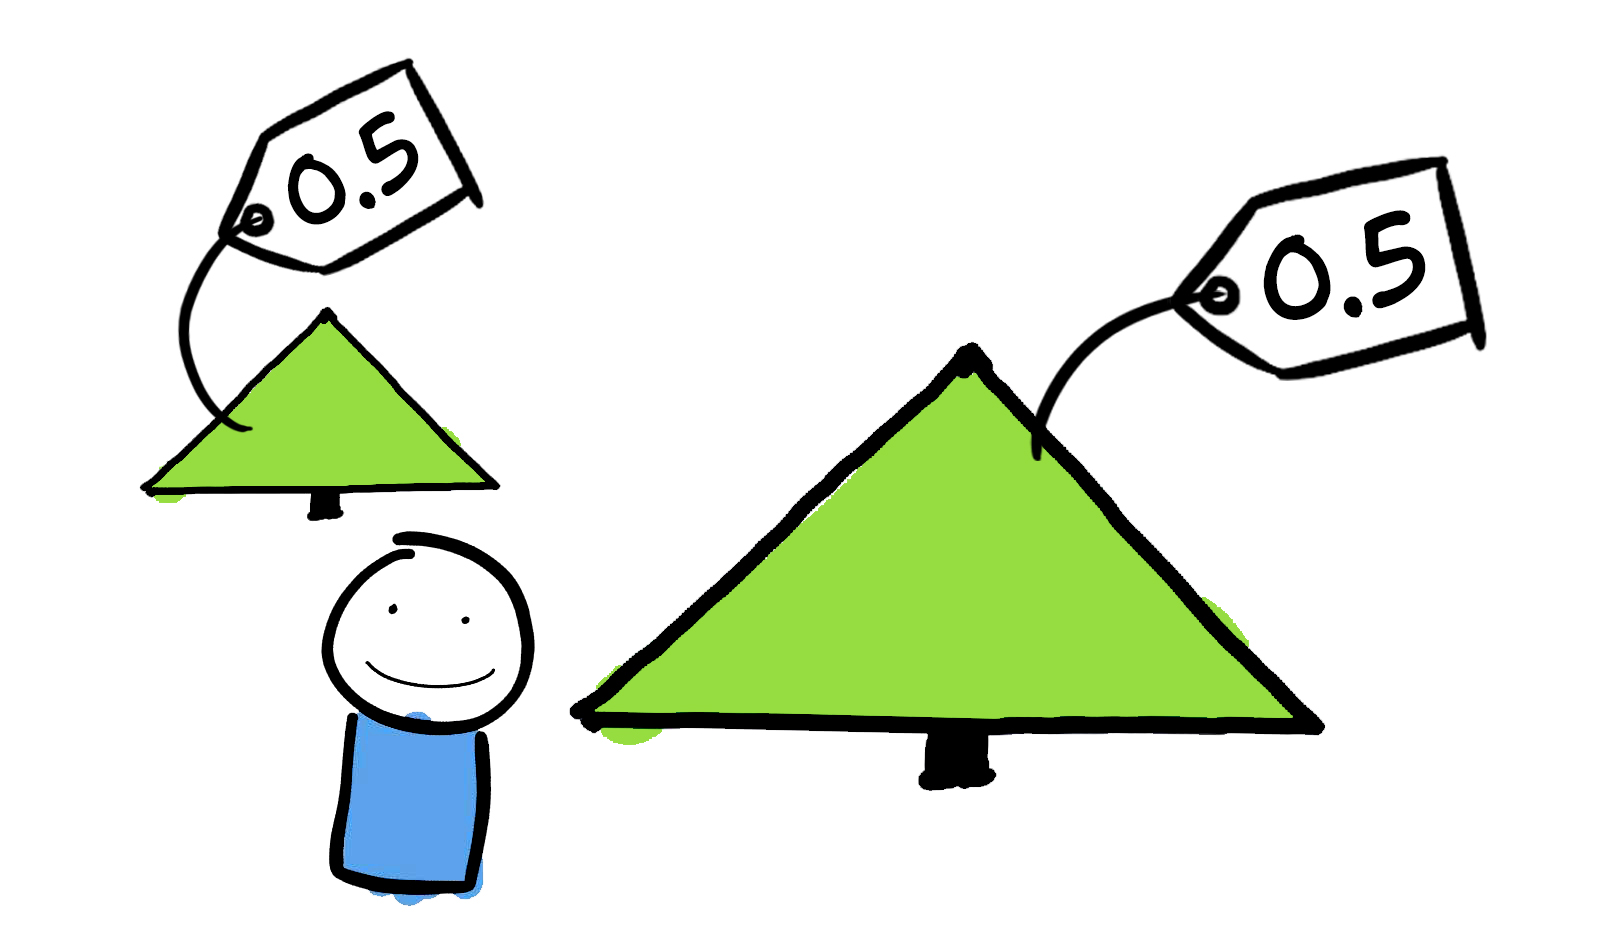
So I can conclude that this label could describe an infinite number of trees! In a way, we’re creating families of similar trees!
What remains unchanged is the look of the trees in the same family. Indeed, there will inevitably be families made up of not-so-beautiful trees 🙁
The beautiful… and the not-so-beautiful trees
Like Carl noticed, we now know that each family of similar trees contains an infinite number of trees. And since the similar trees have the same look, the comparison between trees boils down to comparing the families!
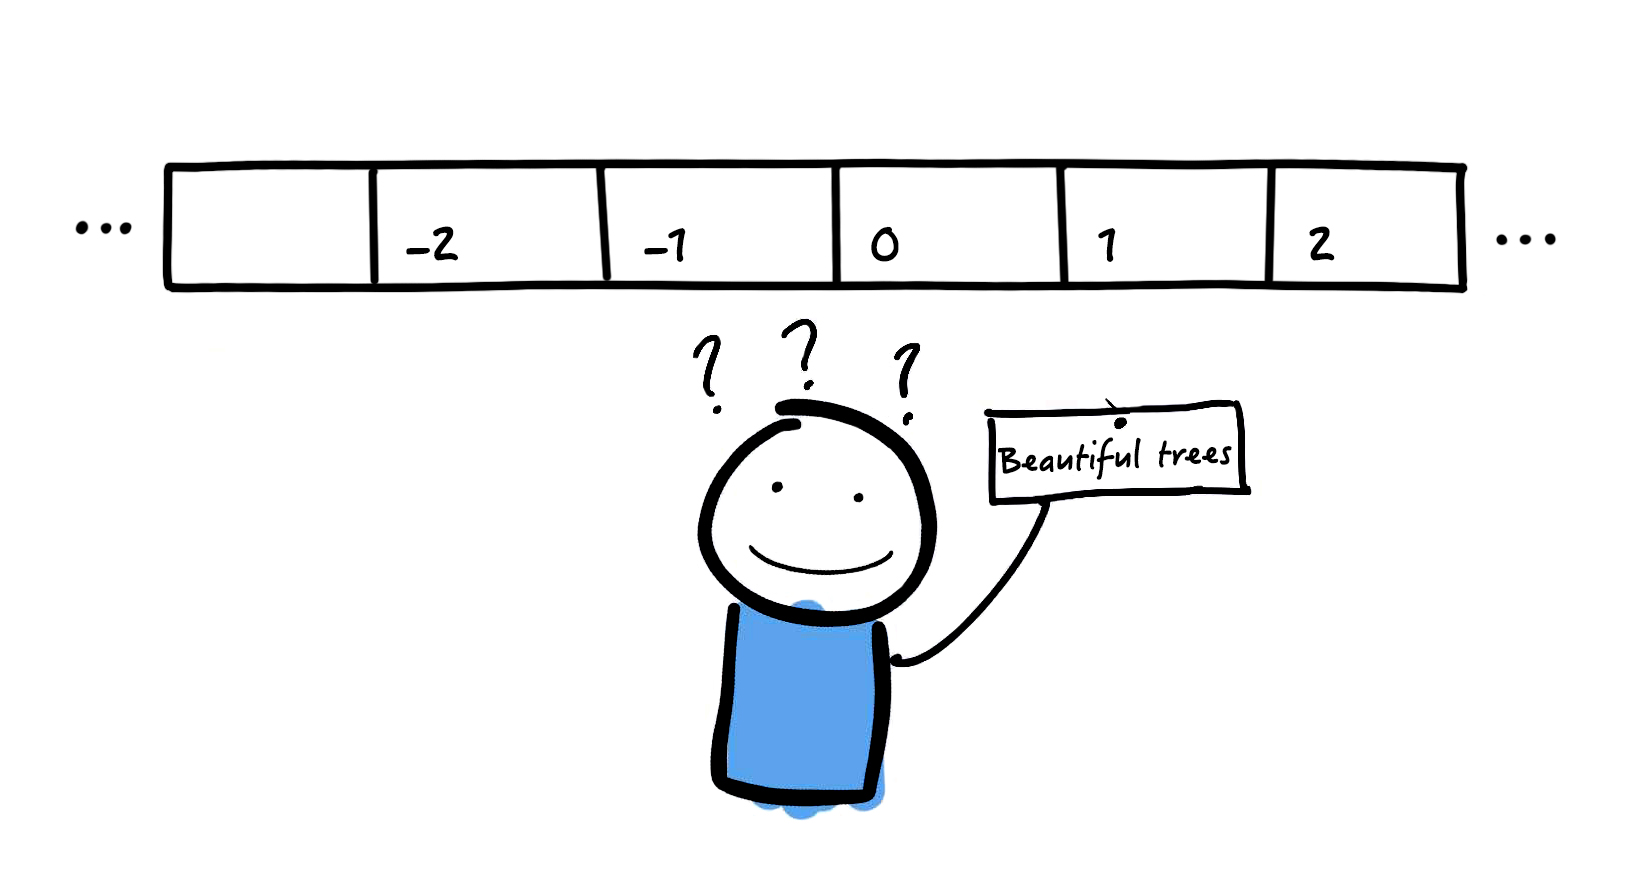
I’m wondering if there are some proportions (labels) that are more promising than others! In your opinion, what ratio is associated with the most beautiful tree? In other words, on a number line, where would you place the “Beautiful trees” label?
At first glance, I would tend to choose a ratio that’s very similar to the value of the golden ratio. It’s a number that’s known to be associated with beauty!
The Golden ratio, also known as the divine proportion, can be found everywhere in nature and according to certain sources, this number is associated with beauty. For example, Gary Meisner wrote a book called The Golden Ratio: The Divine Beauty Of Mathematics.
But nothing could be less certain! Here’s one way to verify this hypothesis. I’m going to show you 4 trees with different ratios (height/width). The measurements of one of these trees respects the proportions of the golden ratio. Can you guess which one it is?
If you chose number 2, you opted for the golden ratio! I’ve got to say, this family of trees really is quite pretty, but I don’t think that we could distinguish between a ratio of 1.6, 1.5, or even 1.4 with the naked eye.
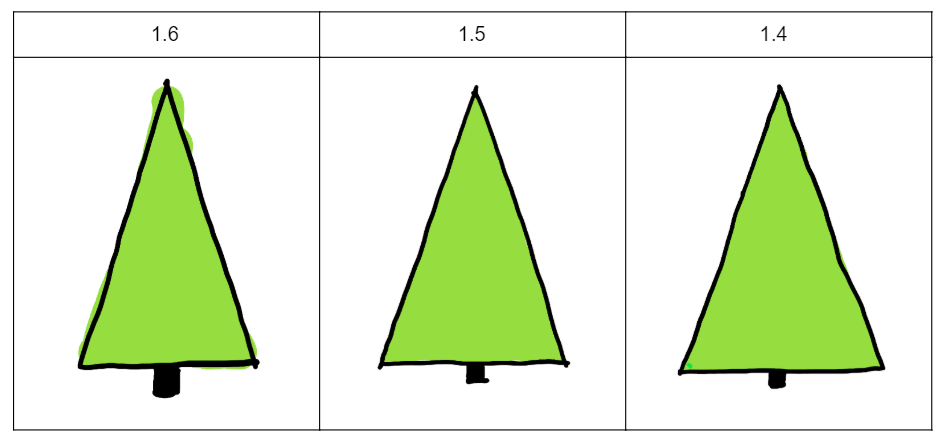
What I mean is that we can see a difference, but I think it’s difficult to say whether a ratio of 1.6 really is prettier than a ratio of 1.5 or even 1.4. In other words, the golden ratio may just be an excellent representation of all of the ratios whose proportions are pleasing to look at. It might be worth spending some more time on this idea in another episode 😉
Let’s get back to our topic trees.
It might be helpful to visualize this situation in the form of a graph. Indeed, here, each family of similar trees is found on the same line. The stocky ones, the slender ones, the well-balanced ones… no matter what the scale, all of the trees where the division of the height by the width is the same are aligned.
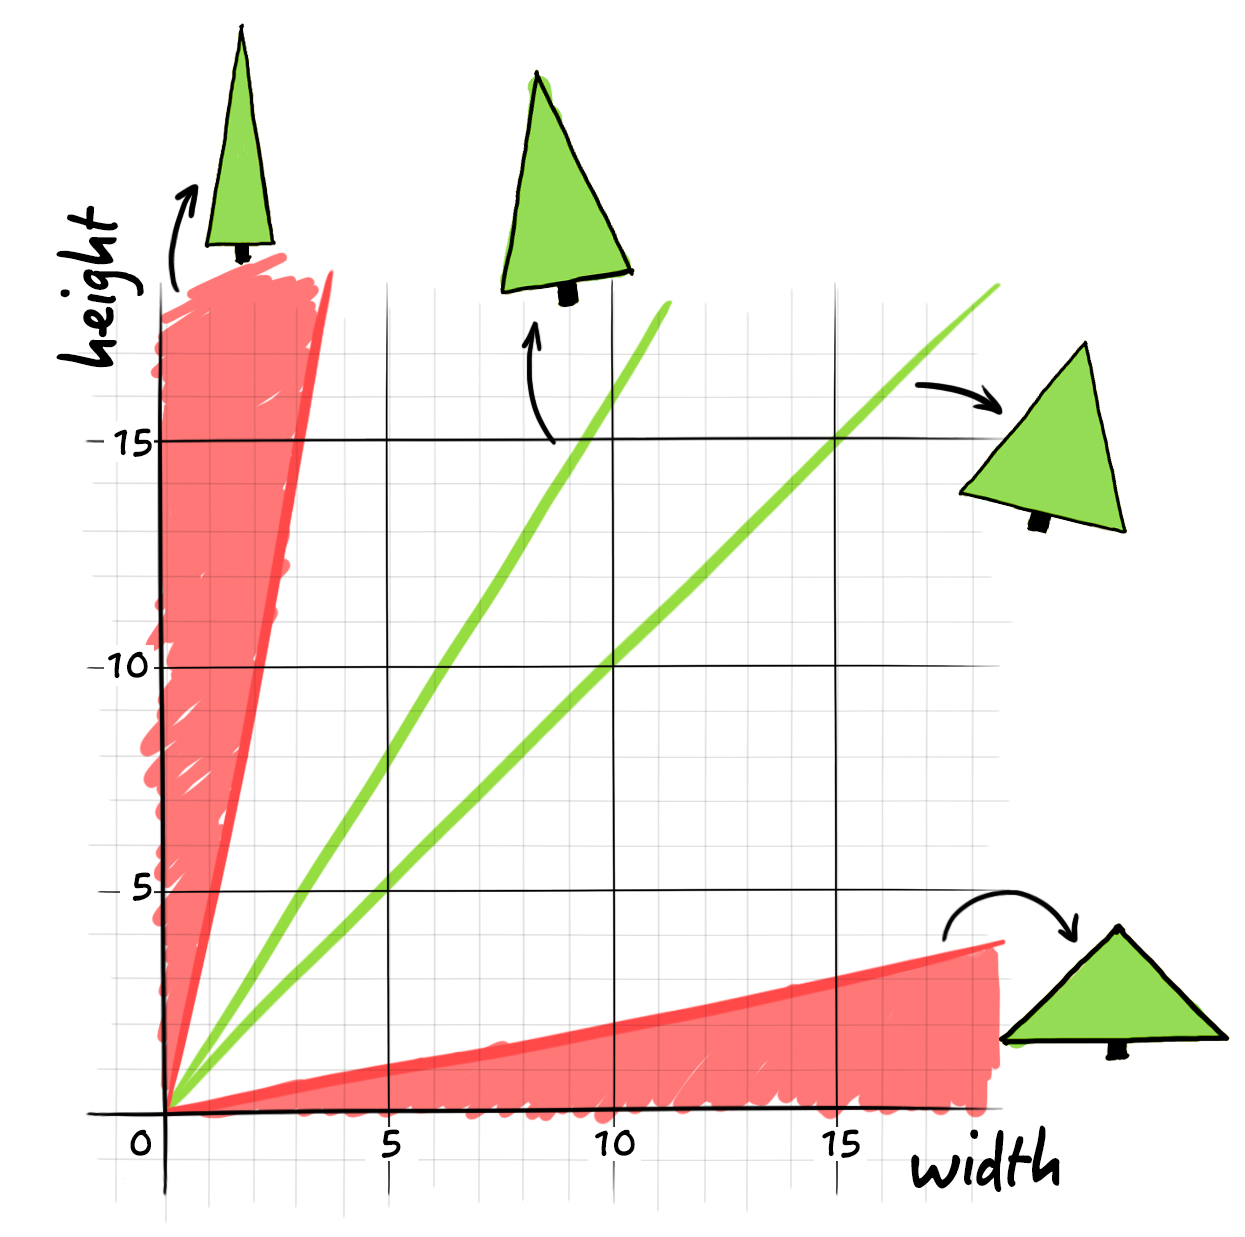
Finally, Carl has to make a decision! First, he identifies the areas of the graph that correspond to trees that are too slender or too stocky. Continuing the elimination process, he manages to determine his favourite family: trees that have a ratio between 1.5 and 1.7 between the height and the width of the base.
Carl just considerably reduced the range of options he has to choose from! But all the same, there is still an infinite number of trees!
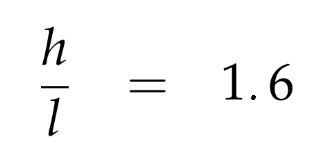
Indeed, for any given height, we can find a width that will make it possible to preserve a proportion of 1.6.
Luckily, before he left home, he measured the height of the ceiling in his living room! This will allow him to determine exactly which tree he should buy. Since his living room has a height of 270 cm, he can calculate the width of the perfect tree:
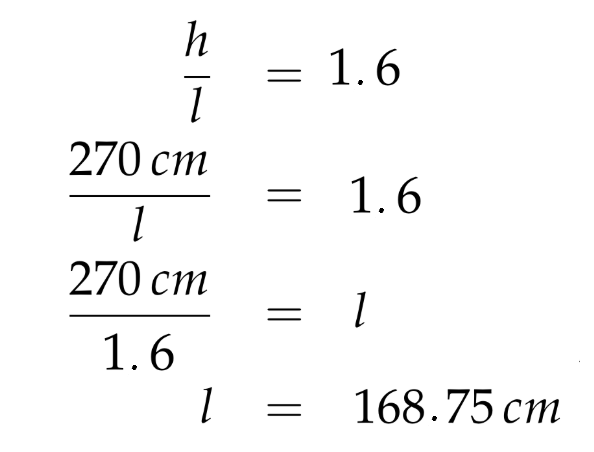
And there you go! Carl finally has everything he needs to find the perfect tree and have the best holiday season ever…
Related activities:
- S2 Find the missing measurements in situations involving congruent or similar shapes: activity 1.
- S2 Solve geometry problems using algebraic expressions: activity 2.
- S2 Use proportional reasoning: activity 3 or activity 4.
- Mission that demonstrates the connection between the golden ratio and the Fibonacci sequence: activity 5.